Is R CrB starting to fade?

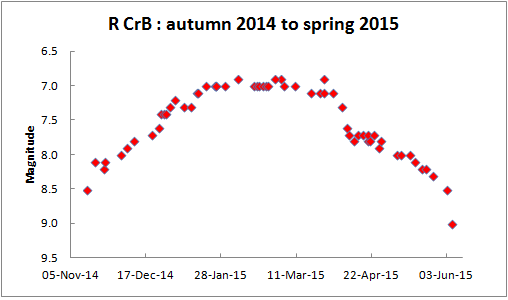
Recent observations suggest that R Coronae Borealis may have peaked in brightness around early March and has started to fade.

Following its record breaking minimum of recent years, R CrB became visible in binoculars again during autumn 2014. Although R CrB is usually around mag 6.0 when at maximum, this recovery slowed in early 2015, with observers reporting it to be still a magnitude or more below this level.

In recent weeks, it seems that the brightening trend has actually reversed with the latest brightness estimates being in the region of mag 7.8.

We have no way of knowing whether this is a temporary setback, or whether R CrB is going to dive back down to 15th magnitude. As ever, the only way to find out is to go out and have a look for yourself.

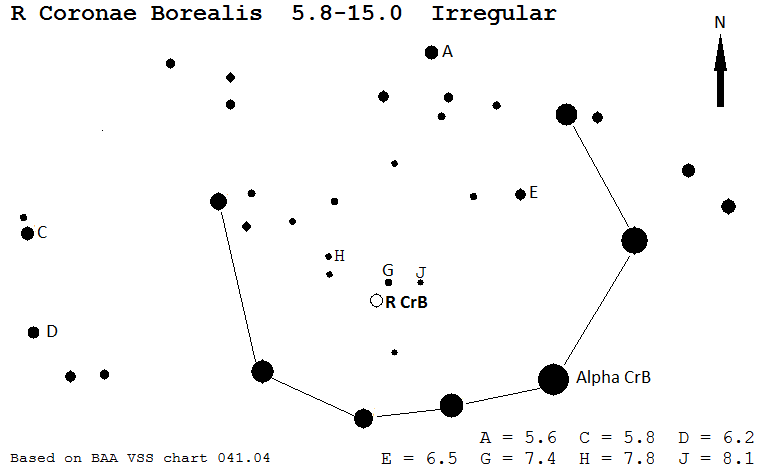
Currently, R CrB is still (just) within the brightness range covered by the comparison stars on this first chart.

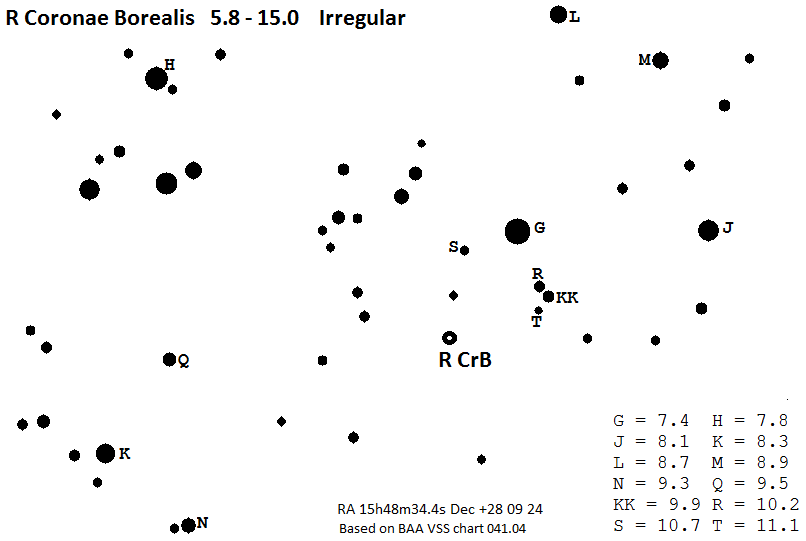
If it fades much further however, you will need to switch to using this second chart.

Useful Variable Star links

AAVSO http://www.aavso.org/

BAA Variable Star Section http://britastro.org/vss/

BAA VSS light curves http://britastro.org/vssdb/

BAA VSS Facebook page https://www.facebook.com/BAAVSS

SPA VSS Facebook page https://www.facebook.com/SPAVSS

The next two guides (PDF downloads) are based on Excel 97-2003, but the principles involved will also apply to later versions (although the method for plotting graphs will be slightly different)

Using Excel to generate eclipse predictions When will eclipses occur?

Using Excel to create phase based light curves for eclipsing binaries When did eclipses occur?

How to observe Variable Stars

Locating the variable star

This is obviously an important first step – you don’t want to accidentally mis-identify it and spend your time observing a different (non-variable) star!

Identifying named eye variables is usually fairly straightforward.

Identifying binocular (or telescopic) variable stars is more challenging. Don’t worry if it takes you 10 minutes or more on the first occasion to make certain that you have located the correct star. With practice, as the weeks pass, you will locate the variable star much more quickly. You might, one day, even reach the stage at which you can point your binoculars at the star and immediately have the star in the field of view.

For many variables, the section provides wide field charts that should allow you to locate the general location of the variable. These will also allow you to identify a familiar bright star from which you can use your binoculars to ‘star hop’ to the variable star. For example, in the accompanying wide field view for R Scuti (Figure 1), you might ‘star hop’ from the star Altair.

r sct

A second chart (Figure 2) then shows a more detailed view of the stars close to the variable.

r sct

A useful pre-requisite is to find the size of the field of view of your binoculars in degrees. This will be very beneficial as it is a big help to know how much of a variable star finder chart will fit into your field of view.

Unfortunately, the “size” of the binoculars (e.g 7×50) doesn’t necessary determine the size of the field of view, as many manufacturers also produce “wide field” versions of each “size”.

If you are lucky, the manufacturer will have printed this on the binoculars next to the eyepiece. If not, however, you can carry out a simple test. The “pointers” (Alpha UMa and Beta UMa) are separated by approx 5.4 degrees. Hence by looking at these through your binoculars and comparing with size of the field of view with their separation, you can get an idea as to the size of the field of view in degrees.

Keeping the binoculars steady

Telescopes (usually!) have sturdy mounts. However, most binoculars are hand held. In order to make a good reliable brightness estimate, you need to keep them steady. Mounting them on a tripod is one possibility, but this can be a hindrance when attempting to observe variables near te zenith. If they are not mounted, find something rigid to hold them against – this could, for example, be the corner of your house, or a fence post.

Estimating the brightness of the variable star

To estimate the brightness of a variable star, we compare the brightness of the variable against that of other (comparison) stars that do not vary in brightness.

To help in this process the section provides star charts that show the position of the variable and its comparison stars, along with the comparison star magnitudes.
z uma

If the variable star appears to be the same brightness as one of the comparisons, you simply record it as having that magnitude.

In other cases, however, you will need to find one comparison star slightly brighter than the variable and one slightly fainter.

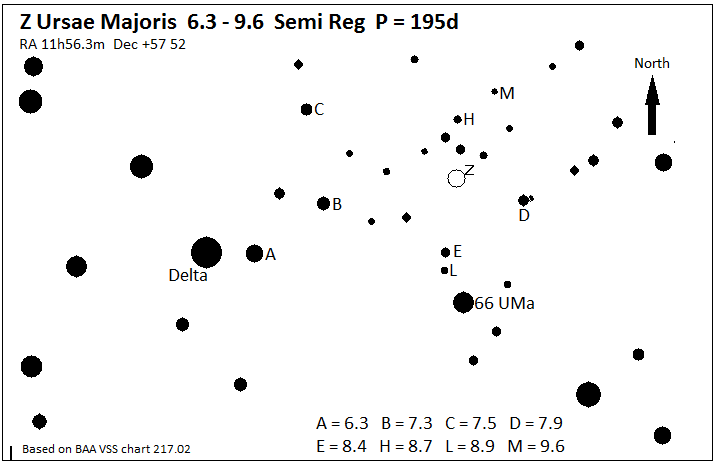
In the accompanying finder chart for Z UMa, suppose that you decide that Z UMa lies between comparisons B (mag 7.3) and D (mag 7.9) in brightness.

If it appears midway between them, then you would report it as being mag 7.6

If it appears slightly closer to comparison D in brightness, you would record it as being mag 7.7

If it appears much closer to D than to B in brightness, you would record it as being mag 7.8.

It is useful however, to record your “thinking” as well as the deduced magnitude. This can be particularly useful if you want to double check your observations at a later date – given the (backward) way that the magnitude system works, it can be easy to have made simple mistakes such as recording a star slightly brighter than a mag 7.9 comparison as being mag 8.0 rather than mag 7.8.

There are two standard ways for recording your “light estimate”:

Method 1: Fractional Method:

This is usually described as being the easiest method for beginners to us. (although, as we shall see, the Maths can become a bit ‘cumbersome’ and so personally I moved on to Method 2 as soon as I could).

Remember that the brightness difference between comparisons B and D in the above example for Z UMa was 0.6 mag.

If you see Z UMa as being equal in brightness to comparison B, you simply record the “light estimate” as  V = B   and record that Z UMa is of mag 7.3.

If you see  Z UMa as being midway between comparisons B and D, you would record this as B(1)V(1)D (note that ‘V’ is always used to represent the variable, whatever its actual name) (Half of 0.6 mag is 0.3 mag, so Z UMa is mag 7.6 (0.3 fainter than B, 0.3 brighter than D).

If you see the difference between B and Z UMa as being double the difference between Z UMa and D, you would record this as  B(2)V(1)D

(Taking into account the 0.6 mag difference between comparisons B and D is 0.6 mag, this equates to 0.4 mag fainter than B and 0.2 mag brighter than D …. i.e. Z UMa is mag 7.7 )

If, however, you see the difference in brightness between Z UMa and comparison D as being four times that between Z UMa and comparison B, you would record this as  B(1)V(4)D . (The maths is slightly harder in this case – having split the difference between B and D into five (1 + 4), you now divide 0.6 mag by 5 … and so each “step is 0.12 mag … and one step below B makes Z UMa mag 7.42. However, the norm (except when plotting eclipse light curves) is to round magnitudes to the nearest tenth of a magnitude … and so you would record Z UMa as mag 7.4).

Method 2: The Step Method:

With experience, observers get a “feel” as to what a difference of 0.1 mag “looks” like.

This makes it possible to switch to the Step method

(not be be confused with the (variably sized) “steps” mentioned above in the Fractional method).

For example, in the Z UMa case, if you see Z UMa as being three 0.1 mag “steps” fainter than comparison B, you record this as “B-3”

Three 0.1 mag steps fainter than comparison B (mag 7.3) is mag 7.6 … so you record your deduced magnitude as 7.6.

It is possible when using the Step method to only compare the variable with only one other star. However, it is generally a good idea to still use two comparison stars – one brighter than the variable and one fainter.

Hence, if you also estimated Z UMa to be four 0.1 mag “steps” brighter than comparison D, your full estimate would be recorded as “B-2, D+4”.

Two  0.1 mag steps fainter than comparison  B (mag 7.3)  is mag 7.5 Four 0.1 mag steps brighter than comparison D (mag 7.5) is mag 7.5

In the above case, both halves of the estimate gave mag 7.5. However, don’t worry if they disagree – simply take the average (and round it to the nearest 0.1 mag).

Suppose, for example, that your light estimate was “B-2, D+3”

Two 0.1 mag steps fainter than comparison B (mag 7.3)    is mag 7.5
Three 0.1 mag steps brighter than comparison D (mag 7.9) is mag 7.6

You now take the average of these two magnitudes (7.5, 7.6), which is mag 7.55

In general (other than for RR Lyr and Eclipsing variables), visual estimates should be rounded to the nearest tenth of a magnitude so, for example, 7.53 would round to mag 7.5 and 7.57 would round to mag 7.6. When the value lies midway between, as in this case, you round it down to the fainter magnitude. Hence you would report the deduced magnitude for this observation as mag 7.6

As a general rule, try to use comparison stars within half a magnitude of the variable – as the number of “steps” used increases, it gets harder to judge the exact number.

Helpful hints and tips

1. Dark Adaptation

It is very important to allow time for your eyes to become adapted to the dark. This is important for two reasons. Most obviously, it allows us to see fainter stars. However, the colour sensitivity of our eyes change as they dark adapt and we need them to be fully dark adapted so that we will compare stars in a consistent way every time that we observe.

You should allow at least 10 minutes to become fully dark-adapted. You will need to allow longer if you have been looking at a PC monitor or watching television as these leave “after-images” on your retina that take quite some time to fade away fully.

>2. Bias

Always observe with an open mind. Record what you see, not what you think you should be seeing. Eclipses, for example, do not always occur at exactly the predicted times and aren’t always symmetrical. Similarly, Mira type variables don’t rise and fall in brightness at constant rates.

3. Red Stars (part 1)

Many variable stars are red in colour (although they will often “appear” to be white – our dark adapted eyes don’t see colour well). The sensitivity of the eye to red light varies from person to person. Don’t worry if your brightness estimates of red stars differ from those made by other observers by several tenths of a magnitude. This is quite common. The key thing is that you should see the variable star brightening when other observers see it brightening and fading when other observers see it fading.

4. Red stars (part 2)

One troublesome feature of the way that our eyes work is that if you stare at a red star, it will appear to brighten compared with other stars! This will obviously affect your brightness estimate. Hence staring at stars should be avoided. Short glances will produce a more accurate estimate.

5. Altitude

Stars that are closer to the horizon will appear to be fainter – dut to the greater depth of atmosphere that their light must travel through. If possible, always use comparison stars that are nearly at the same altitude as the variable star.

6. Positioning the variable

When using binoculars or as telescope, always bring the variable and comparison star in turn to the centre of the field of view.

If a variable cannot be seen by direct vision, then it may be glimpsed by using averted vision. Always record when the variable was glimpsed with averted vision.

7. Sky conditions

There will be occasional nights when the atmosphere is so unsteady that it is impossible to make accurate estimates – stars may fade or brighten relative to each other as you watch them. Unfortunately, there is nothing that you can do in such circumstances other than to see if conditions have improved after an hour or more or to try again on another night when sky conditions will hopefully be better.

Submitting Observations

Please do report your observations to the section.

The preferred method is described in this guide.

Guide to R Coronae Borealis

A star that spends most of its time near maximum, but which at times unpredictable in advance will fade dramatically.

Having said that, it did start a fade in the summer on 2007 that turned out to be record-breakingly long. It was not finally returning back to maximum until early 2015 … or so it seemed … it fell a magnitude short and then faded again !

r crb

Another recovery started during the spring of 2016, reaching binocular visibility during the autumn. The brightening seemed to pause in early 2017, but by the late spring it was slowly brightening again.

Most fades of R CrB, however, have been much shorter than the one that started in 2007. Typically they have lasted for a few months or maybe a year or two. Some fades will only go down two or three magnitudes, but others will take it all the way down to 15th magnitude. Sometimes it starts to brighten from a fade, but then drops back down again – R CrB is that unpredictable!

Extreme brightness range 5.8 – 15.0
More typical range 6.1 – 6.4 (until a fade starts …)
Period of variation None – totally unpredictable
Frequency of observation Worth checking on every clear night
Observe using 40mm or 50mm binoculars will suffice for most of the time, but 50-80mm binoculars will be required during smaller fades and a telescope is required during the deepest fades
Visibility Can be observed all year round, but is rather low in the evening sky in November and December. From late October it is visible in the pre-dawn sky and is only visible in the morning sky from Christmas to the end of January

Here is a finder chart (approx 11 degrees x 8 degrees, with north at the top) which will allow you to locate R Coronae Borealis when it is near maximum. You can use the labelled comparison stars to make brightness estimates of R CrB and hence to watch out for the onset of fades.

.

You will need to use this next chart when R CrB drops below the brightness of comparison J :

.

Guide to R Ursae Majoris

A Mira type variable star located a few degrees north of the ‘pointers’ of the Plough.

R UMa

Like other Mira type variables, R Ursae Majoris is red giant star. The brightness variations are mostly due to pulsations in its outer layers. However, the brightness doesn’t rise and fall at a constant rate because as the star’s surface cools during the expansion phase, some very simple molecules are able to form and these absorb some of the light being emitted. When the surfaces warms again during the contraction phase, these molecules split apart.

Extreme brightness range 6.7 – 13.4
More typical range 7.2 – 13.0
Period of variation 302 days – approx 10 months
Frequency of observation Worth checking a few times per month
Observe using 50mm binoculars will suffice when it is near maximum. Larger binoculars will be needed when fainter. A telescope is required if you want to follow it down to minimum
Visibility Circumpolar – can be observed all year round.
Dates of maxima September 2025

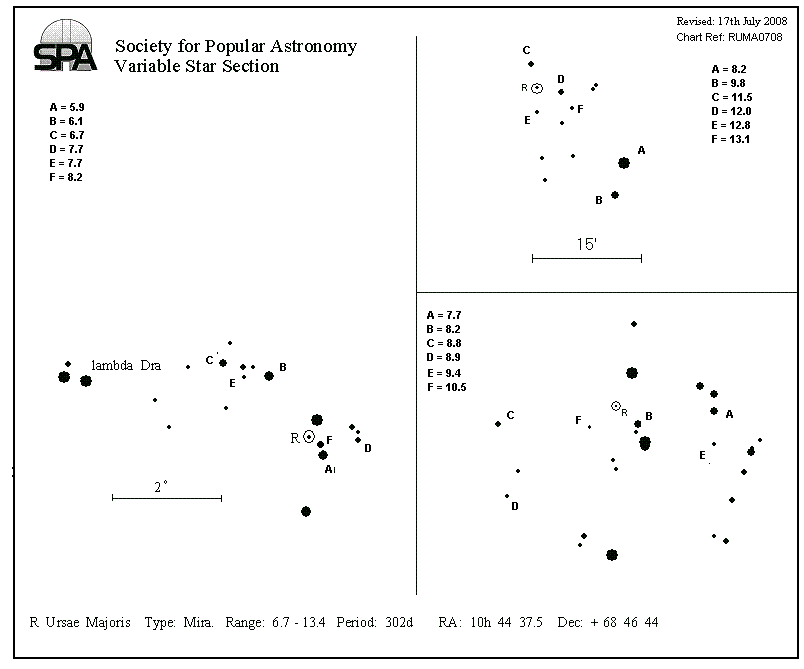
The finder chart below shows the location of R Ursae Majoris.

R_Ursa_Majoris

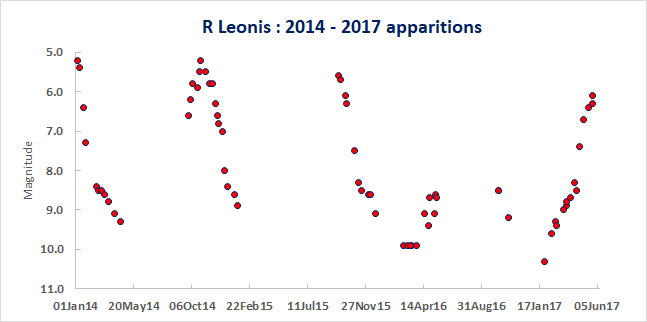
Guide to R Leonis

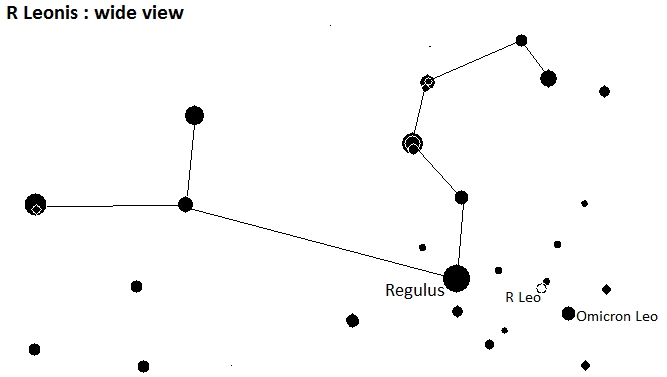
One of the brighter Mira type variables, located only 5 degrees from the bright star Regulus (Alpha Leonis).

r leo

R Leonis, like other Mira type variables, is a red giant star. The brightness variations were first recognised by J A Koch in 1782. The main cause of the brightness variations is pulsations in the star’s outer layers. However, there are also smaller scale changes that are related to the formation of very simple molecules when the pulsations cause the surface layers to cool and then split apart when the contraction phase causes the temperature to rise again.

Extreme brightness range 4.8 – 11.0
More typical range 5.4 – 10.5
Period of variation 310 days (approx 10months)
Frequency of observation Worth checking a few times per month
Observe using 40mm or 50mm binoculars will suffice when near maximum, but 50-80mm binoculars will be required when fainter. A telescope is required to follow R Leo all the way down to minimum
Visibility mid September to early June
Dates of maxima January 2025, November 2025

The following finder charts show the location of R Leonis. North is at the top of each chart.

.

The second chart, which is approx 9 degrees by 5 degrees, shows more detail around R Leo.

You can follow the changes in R Leo by comparing its brightness with that of the comparison stars. These are labelled with their magnitudes (with the decimal point omitted). Thus, for example, ’78’ labels a comparison star of magnitude 7.8.

.

Guide to RZ Cassiopeiae

RZ Cas is the best eclipsing variable for beginners.

Tracie Heywood’s light curve showing a primary eclipse

The eclipses of RZ Cas take less than 5 hours – indeed most of the ‘action’ takes place during the middle three hours.

This means that it is possible to observe a whole eclipse without needing to stay out all night.

The shortness of the eclipse also reduces the risk that the sky will cloud over part way through the eclipse.

Another helpful feature is that the eclipses are quite frequent – taking place very 29 hours.

Not only that – RZ Cas is also easily circumpolar for observers in the UK.

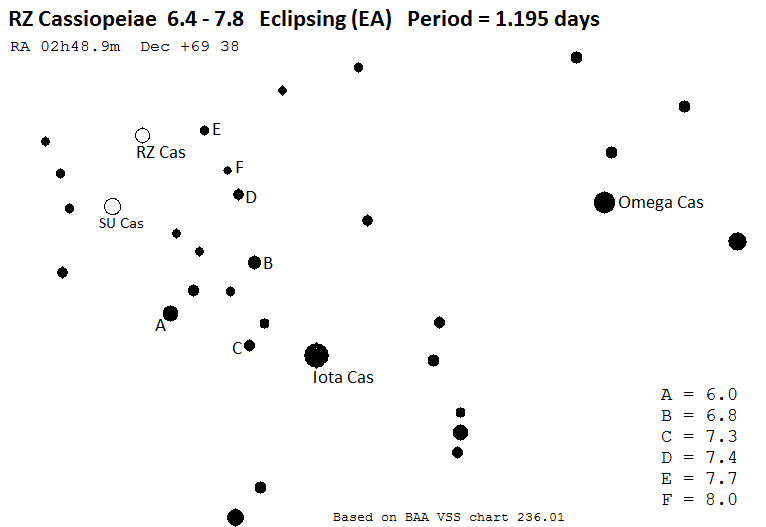
And the comparison star sequence is rather good – with mag 7.4, mag 7.7 and mag 8.0 comparison stars being located close to the variable. This contrasts with the situation for brighter eclipsing variables, such as Algol, for which the comparison stars may be a considerable distance away on the sky).

RZ Cassiopeiae is a similar type of eclipsing variable to Algol (Beta Persei). The orbital plane of the two stars in the RZ Cas system is edge on as seen from the Earth. The deep primary eclipse occurs when the brighter star is eclipsed by the fainter star. The secondary eclipse (in which the fainter star is eclipsed) is too shallow to be spotted visually. The brightness of RZ Cas is constant between eclipses.

Extreme brightness range 6.4 – 7.8
More typical range always the same
Period of variation 1.195247 days (approx 29 hours)
Frequency of observation Estimate the brightness every 20-30 mins during primary eclipse
Observe using 50-80mm binoculars
Visibility Can be observed all year round, but is lowish in the evening sky from April to June

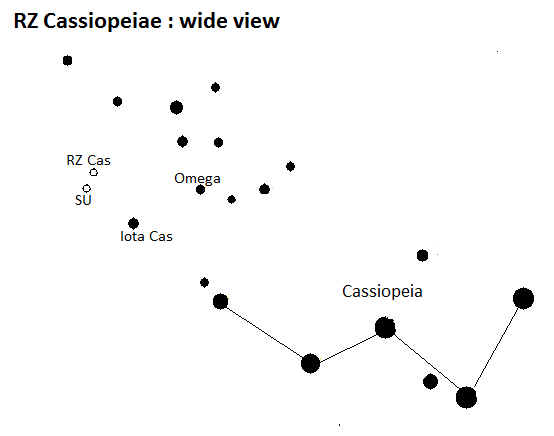
Here are finder charts that shows the location of RZ Cassiopeiae:RZCas_wide

This second chart, which is approx 8 degrees by 6 degrees, shows the area around RZ Cas in more detail.

You can make brightness estimates by comparing the brightness of RZ Cas with that of the lettered comparison stars.

Outside eclipses, RZ Cas will appear brighter than comparison B (and slightly fainter than SU Cas). Around mid eclipse it will be similar in brightness to comparison E, possibly slightly fainter if you catch it at mid eclipse. SU Cas is a low amplitude Cepheid variable star whose brightness variations (range 5.9-6.3) are too small to easily follow visually.RZCas_chart

Guide to U Coronae Borealis

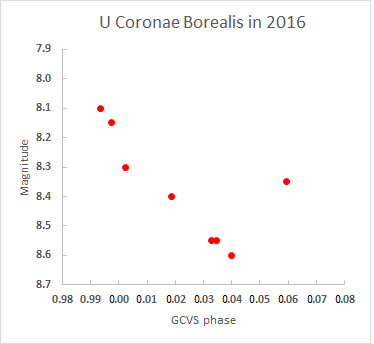
An eclipsing variable in which the primary eclipse is a magnitude deep.

U CrB

U Coronae Borealis is a similar type of eclipsing variable to Algol (Beta Persei).

Eclipses occur every 3.45 days – approx half of a week -so if you see one, there will be a chance to see another one in just under 7 days (the intervening eclipse having occurred during daylight).

The primary star is a blue-white dwarf (i.e. main sequence) star.

The primary eclipse occurs when the secondary star in the U CrB system – a white sub-giant star – passes in front of it , blocking off its light.

Eclipses last for approx 11 hours. This can make it tricky to observe a whole eclipse in one session.During the spring and summer months, the nights are not this long. During the autumn and winter months, U CrB is not above the horizon for this long.

The best time to catch an eclipse is probably during March, when the nights are almost long enough and U CrB is observable nearly all night. At other times of the year, you will need to observe the fade into eclipse and brightening from eclipse on different nights – possibly weeks apart – and then “join” the two together to create your light curve.

Extreme brightness range 7.8 – 8.8
More typical range always the same
Period of variation 3.45 days
Frequency of observation Check every 30 mins during primary eclipses
Observe using 50-80mm binoculars
Visibility Star is visible all year round, but nightly visibility is rather short from November to January

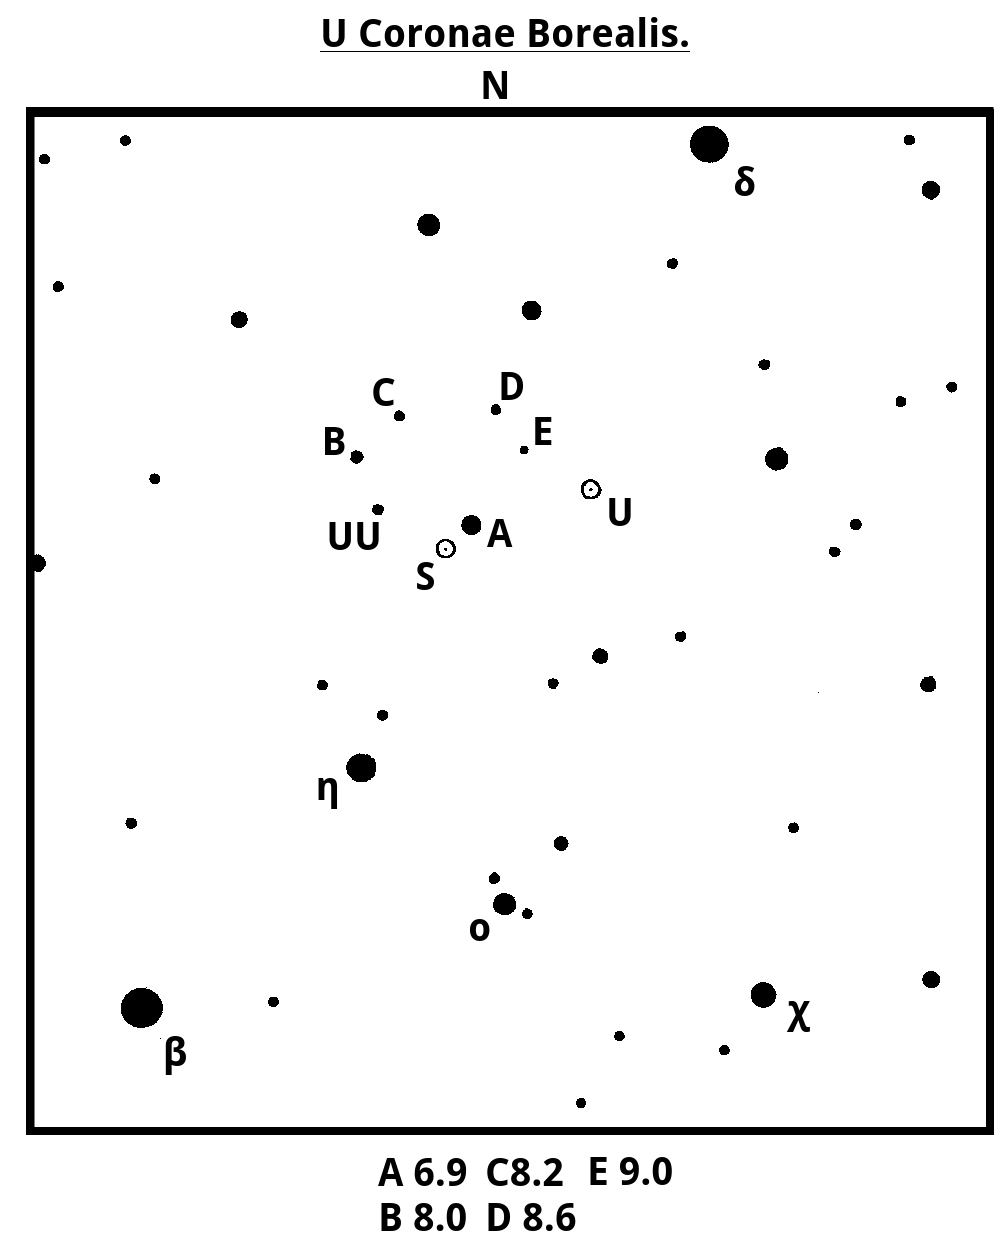
The finder chart below, shows the location of U Coronae Borealis.

U_CrB

You can follow the changes in U Coronae Borealis by comparing its brightness with that of the lettered and numbered comparison stars. Outside of eclipse it will be slightly brighter than comparison B. In mid eclipse it becomes fainter than comparison D.

(Note that S CrB is a Mira type variable which currently is only visible in binoculars from August to November).

Guide to S Ursae Majoris

A very red Mira type variable located near the main stars of the ‘Plough’.

S UMa

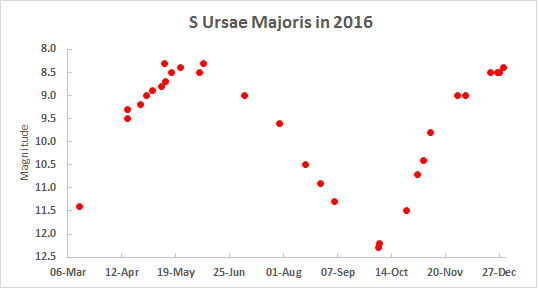
S Ursae Majoris is a red giant star. Its brightness changes are primarily due to pulsations in its cool outer layers, but are also affected by the formation and break up of simple molecules as the star’s surface temperature changes.

Due to the star’s strong red colour it is not unusual for some observers to see S UMa more than half a magnitude brighter/fainter than how it is seen by other observers. This is merely a consequence of how the eyes of different people differ in their sensitivity to light at the far red end of the spectrum.

Whereas the maxima of many Mira type variables tend to be fairly “sharp”, that of S UMa is more “flat topped” and it can linger near maximum for around two months.

Extreme brightness range 7.2 – 12.7
More typical range 7.9 – 11.7
Period of variation 226 days (approx 7.5 months)
Frequency of observation Worth checking a few times per month
Observe using 50-80mm binoculars when near maximum. A telescope will be required to follow it down to minimum
Visibility Star is circumpolar
Upcoming maxima January 2025, September 2025

The chart below shows the location of S Ursae Majoris.

S_UMa

Guide to T Ursae Majoris

A Mira type variable, located not far from the star Delta Ursae Majoris, that reaches maximum every 8.5 months.

t uma

T Ursae Majoris is a red giant star. Its brightness variations are primarily due to pulsations in its outer layers. These pulsations not only cause that star to expand and contract slightly, they also affect its surface temperature. The cooling phase allows some very simple molecules to form and these then dissociate during the warming phase. Absorption of light by these molecules leads to small irregularities in the light curve and hence the star doesn’t brighten and fade at a constant rate.

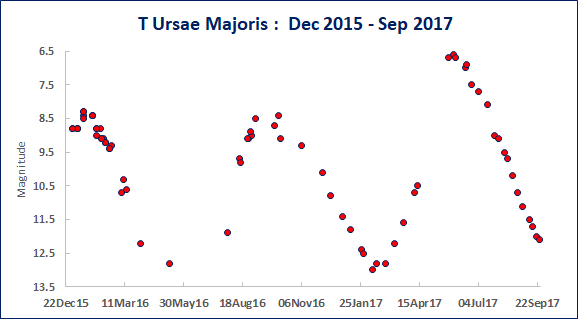
The brightness variations don’t repeat exactly from one cycle to the next – it is not unusual for successive maxima to differ in brightness by half a magnitude or more – indeed, the spring 2015 peak (mag 6.6) and January 2016 peak (mag 8.3) differed by nearly 2 magnitudes!  Similarly, predictions for the dates of future maxima will always be uncertain by a week or two.

Extreme brightness range 6.6 – 13.5
More typical range 7.7 – 12.9
Period of variation 257 days (approx 8.5 months)
Frequency of observation Worth checking a few times per month
Observe using 50-80mm binoculars. A telescope will be required to follow it all the way down to minimum
Visibility Circumpolar – can be observed all year round,
Dates of maxima March 2025, September 2025

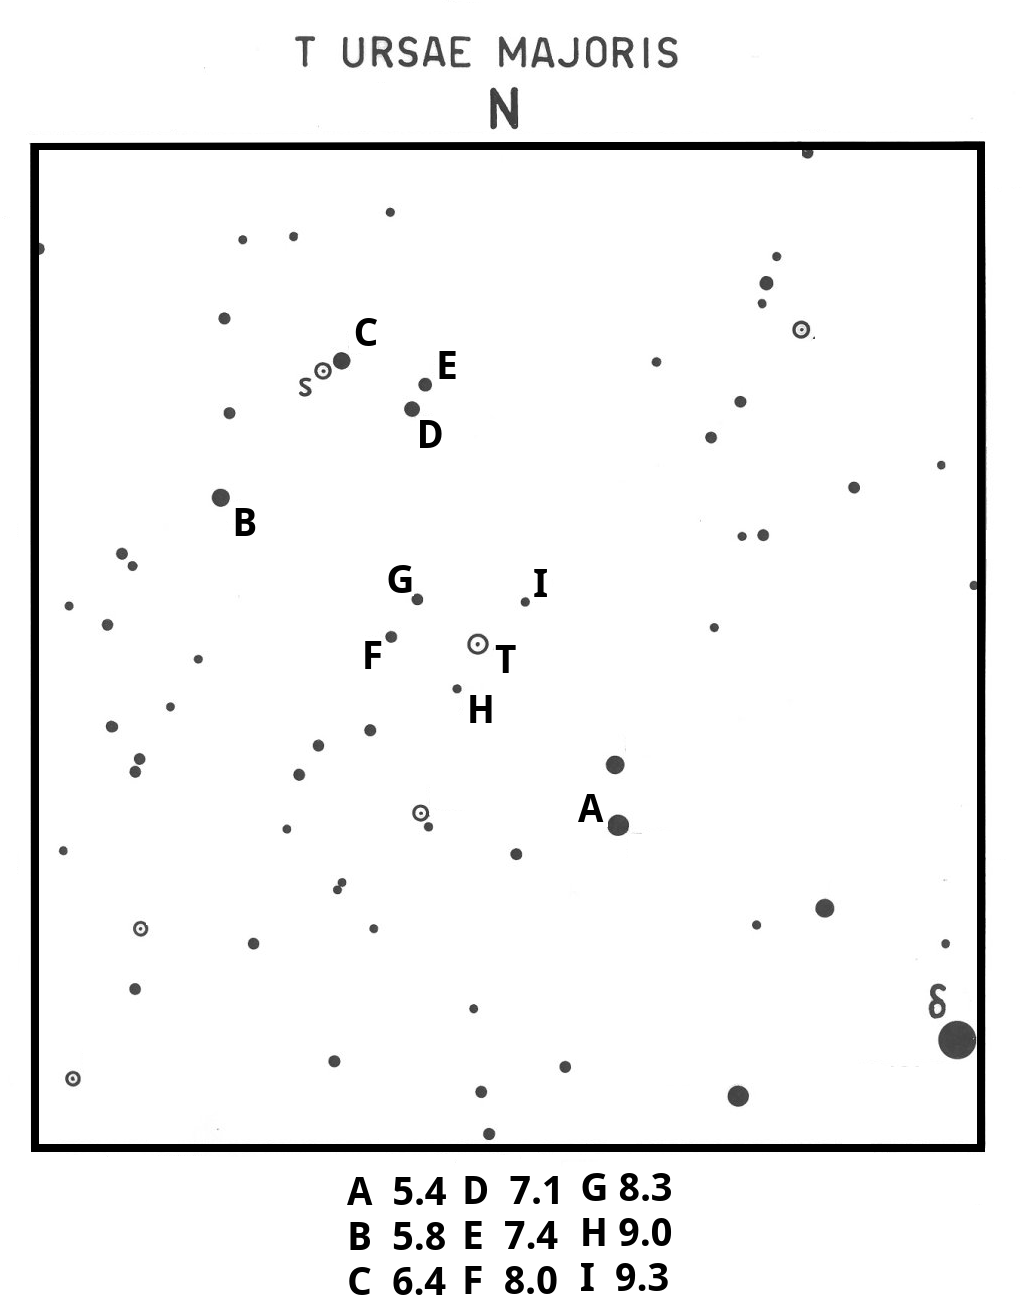
The following finder chart showS the location of T Ursae Majoris.

T_UMa