Guide to R Trianguli

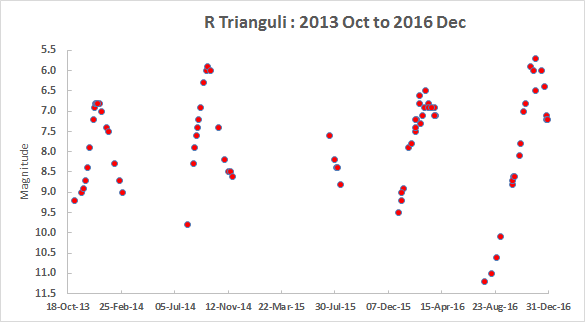
One of the brightest Mira type variables, going up & down in brightness every 7.5 months.

R Tri

Like other Mira type variables, R Trianguli is a red giant star whose brightness variations are due primarily to pulsations in its outer layers but also, to a lesser extent,  to the formation and destruction of very simple molecules in its (relatively) cool outer layers.

Also, as for other Mira type variables, the brightness changes don’t repeat from one cycle to the next. The brightness at maximum changes from one maximum to the next and there is always an uncertainty of around +/- 2 weeks in any predicted dates of maxima.

There is a gap each year when R Trianguli is near conjunction and not visible in the night sky. This runs from mid April to mid June and was responsible for the 2015 maximum being missed in the above light curve.

Extreme brightness range 5.4 – 12.6
More typical range 6.0 – 11.7
Period of variation Approx 7.5 months
Frequency of observation Worth checking a few times per month
Observe using 40mm or 50mm binoculars when near maximum. 50-80mm binoculars when fainter. A telescope is required to follow it all the way down to minimum
Visibility late June to early April
Dates of maxima September 2025

The finder chart below shows the location of R Trianguli.

R_Tianguli

Guide to Omicron Ceti (Mira)

A star which over the year fluctuates between being visible with the naked eye and being so faint that it is only visible using larger binoculars or a telescope.

Mira

The brightness variations of Mira were first recognised in 1596. However, it was not until several decades later that observers realised that it was going up and down in brightness every 11 months.

Note the steep rise towards maximum, with Mira brightening at one stage by several magnitudes in just a few weeks.

As can be seen, there is an annual gap during the spring and early summer when Cetus is in conjunction with the Sun and therefore Mira is not observable from the UK. Recent maxima had been occurring during this spell, but we came quite close to seeing the peak in 2016, with Mira reaching mag 3.3 by mid March. From 2017 onwards, maxima become visible again and over the years that follow will become progressively better placed in the evening sky. Minimum brightness is currently occuring around mid autumn.

Mira is the prototype ‘Mira type variable’.  It is a red giant star whose outer layers pulsate. These pulsations not only cause the star to expand and contract slightly, they also cause changing in its surface temperature. During the cooling phases, very simple molecules form and these them dissociate when the surface warms again. However, while they exist, they absorb some of the light being emitted by the star. Hence the brightness doesn’t rise and fall at a constant rate. These molecules cause ‘irregularities’ in the rise and fall.

The brightness changes don’t repeat exactly from one 11 month cycle to the next. Some maxima are brighter than others and the date of maximum can only be roughly predicted in advance.

Extreme brightness range 1.7 – 10.1
More typical range 3.6 – 9.3
Period of variation About 11 months
Frequency of observation Worth checking a few times per month
Observe using Naked eye when near maximum. 40mm or 50mm binoculars when it is less bright. Larger binoculars or a telescope when it is near minimum .
Visibility Can be observed from the UK from late July to early March
Upcoming maxima April 2025

The following finder charts show the location of Omicron Ceti. Both have north at the top.

The first shows the brighter comparison stars. The ‘V’ shape of the Hyades can be a useful pointer towards the location of Mira.

.

The second shows the comparison stars to use when Omicron Ceti is in the lower half of its brightness range.

.

Guide to U Orionis

A Mira type variable, near the Taurus/Gemini border, that currently reaches maximum brightness in the mid spring. Gaps occur in the light curve each year from May to August when U Ori is not observable in the might sky

A 2-year light curve for U Orionis

U Orionis is a red giant star. Its brightness variations are primarily due to pulsations in the star’s outer layers that not only cause the star to expand and contract, but which also lead to corresponding changes in its surface temperature.

The surface temperature changes also allow simple molecules to form as the surface cools and then disassociate when it warms again – and these also affect the star’s brightness – it doesn’t rise and fall in brightness at a constant rate.

Extreme brightness range 5.3 – 12.6
More typical range 6.3 – 12.0
Period of variation 372 days ( a week longer than a year)
Frequency of observation Worth checking a few times per month
Observe using 50mm binoculars will suffice for most of the time, but 50-80mm binoculars will be needed to cover the middle of its range. A telescope will be required to follow it all the way down to minimum
Visibility Can be observed from mid August to early May
Dates of maxima May 2025

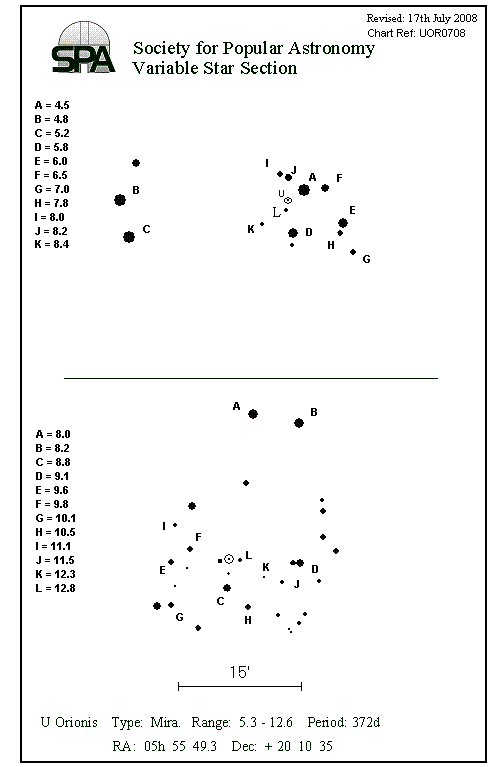
The chart below shows the location of U Orionis.

U_Orionis

Guide to RR Lyrae

A star that goes up and down in brightness by around a magnitude every 13 hours.

rr lyr

RR Lyrae is a white subgiant star. The brightness variations are due to pulsations in the star’s outer layers.

In some ways, RR Lyrae type variables are slightly less luminous cousins of the Cepheids in that they follow a similar period-luminosity law (thus making it possible to use them to dermine distances to other galaxies). They are however at a different stage in their evolution. Their spectra show that they are “metal poor” indicating that they are somewhat older than our Sun. They have previously gone through the red giant stage and are now in the final stages of their evolution.

Unlike the Cepheids, however, their light curves don’t quite repeat exactly from one cycle to the next – their amplitude can vary slightly. Despite a century of study, astronomers still do not have a clear explanation for this. In addition, their observed times of maxima can drift out of line with those predicted by the orbital elements in the GCVS.

Extreme brightness range 7.0 – 8.1
More typical range (almost) always the same
Period of variation 0.567 days (approx 13 hours)
Frequency of observation every 30 – 45 minutes
Observe using 50-80mm binoculars
Visibility Can be observed all year round, but is rather low in the evening sky from January to April

The finder chart below shows the location of RR Lyrae.

RR_Lyrae

You can follow the brightness changes in RR Lyrae by comparing it with the comparison stars that are labelled with their magnitudes (these have the decimal points omitted so, for example, ’76’ labels a comparison star of magnitude 7.6).


Guide to Alpha Herculis

A slowly changing variable star that is observable with the naked eye from reasonably dark observing sites.

Four year light curve for Alpha Herculis

With Alpha Herculis being a quite red star, magnitude estimates can differ by a few tenths of a magnitude between observers. Hence, rather than plot this light curve with magnitude values on the vertical scale (and risk confusing observers whose magnitude values don’t exactly match those shown) , the scale has been left blank.  Although some observers will routinely see Alpha Her brighter than will other observers, the hope is that each observer will see a similar pattern of rises and falls in brightness.

Alpha Herculis is a red supergiant star. It doesn’t show huge changes in brightness but, with care, its brightness changes can be followed visually. The brightness changes are due to pulsations in the star’s cool outer layers.

Extreme brightness range 3.0 – 4.0
More typical amplitude about 0.4 mag
Period of variation Some sources suggest 100 days ; others suggest around 300 days
Frequency of observation Worth checking a few times each month
Observe using Naked eye from reasonably dark observing sites. May need to use 40mm or 50mm binoculars if light pollution is a problem.
Visibility Can be observed all year round, but is not visible in the evening sky from December to April

The finder chart which follows show the location of Alpha Herculis.

You can follow the brightness changes of Alpha Herculis by comparing it with the lettered comparison stars.

Guide to Z Ursae Majoris

A reliable variable star located in the ‘bowl’ of Ursa Major.

Z UMa

Z Ursae Majoris is a red giant star whose brightness variations are due to pulsations in its outer layers. Although it is classed as a semi-regular variable, Z UMa can be relied upon to produce a good amount of brightness variation on a regular basis.

Extreme brightness range 6.3 – 9.8
More typical range 6.9 – 8.7
Period of variation About 6 months (longer secondary period is also present)
Frequency of observation Worth checking a few times per month
Observe using 50mm binoculars will suffice for most of the time, but 60-80mm binoculars may be required during the deeper minima
Visibility Can be observed all year round. Circumpolar

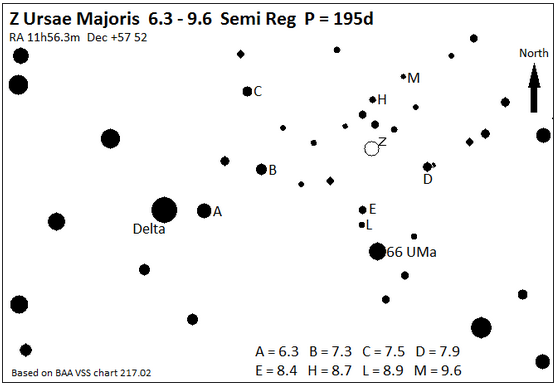
The following charts show the location of Z Ursae Majoris.

You can follow the brightness changes of Z UMa by comparing its brightness with that of the lettered comparison stars.

The first shows the wide area view and labels the brighter comparison stars (A to D).

Wide angle finder chart for Z UMa

The second shows the fainter comparison stars.

Binocular chart for Z UMa


Guide to Betelgeuse (Alpha Orionis)

A bright variable star that shows slow changes over the course of several years.

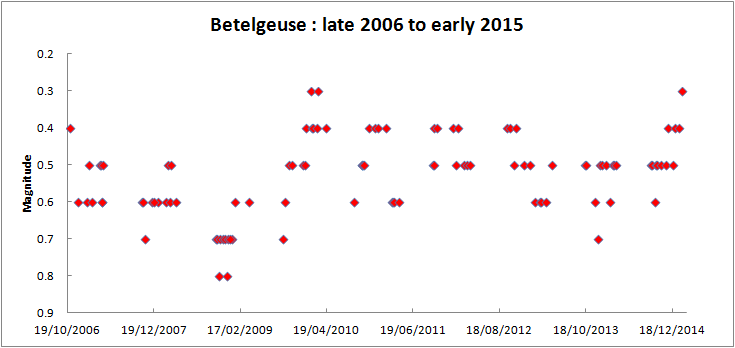
Betelgeuse is a red giant star that is in the final stages of its evolution. Currently it shows slow semi-regular brightness changes with a range of up to half a magnitude. The brightness changes are related to pulsations in its outer layers. However, the appearance and disappearance of large convection cells on its surface may also influence the brightness changes seen.

Although some sensational news stories may give you the impression that Betelgeuse is about to go supernova, the chances of this are very small and the supernova will most likely not occur for many thousands of years.

Extreme brightness range 0.4 – 1.3
More typical range 0.4 – 0.8
Period of variation Possible around 4 years (although the GCVS gives a longer value of 2070 days)
Frequency of observation Worth checking once or twice each month
Observe using Naked Eye
Visibility Can be observed from mid August to late April

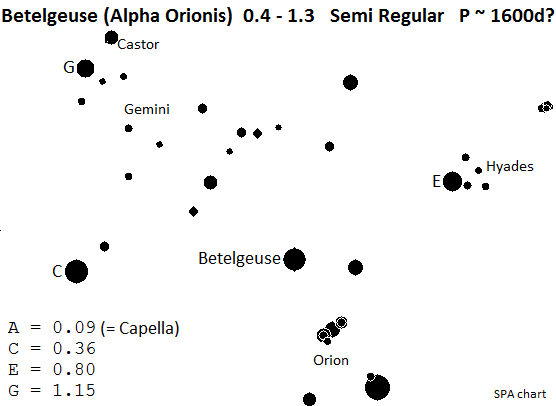
The chart below shows the comparison stars for Betelgeuse.

When observing Betelgeuse take care to ensure, whenever possible that the comparison stars used are at a similar altitude to Betelgeuse. Otherwise dimming by haze can affect the accuracy of your brightness estimates. For this reason, Rigel should not be used as a comparison star.

Guide to Delta Cephei

The “prototype” Cepheid variable star, going up and down in brightness every 5.366 days in a very predictable way.

delta cep


This light curve was created using all of the observations made by SPA VSS members during a single year.

Since the brightness changes repeat exactly from once cycle to the next, it is possible to combine all observations into a single light curve showing how the brightness changes during each 5.366 day cycle.

For each observation, the phase (i.e. fraction of the 5.366 day cycle completed) of Delta Cephei was calculated. This might seem a daunting task, but you can do this for your own observations via this  helpful spreadsheet (which will also plot a light curve for you)

As can be seen from the resulting light curve, the rise to maximum is somewhat steeper than the fade back down to minimum. This is the case for the majority of Cepheids, There are exceptions to this pattern, however – one such exception is the star Zeta Gem (which also on the section’s programme) in which the light curve is more symmetrical.

Extreme brightness range 3.4-4.3
More typical range always the same range
Period of variation 5.366 days
Frequency of observation Worth checking on every clear night
Observe using Naked eye – if you have a reasonably dark observing site. Otherwise use 40mm or 50mm binoculars.
Visibility Can be observed all year round, but is fairly low in the evening sky from March to May

Delta Cephei, like other Cepheid variables, is a yellow pulsating supergiant star whose outer layers pulsate in a very regular way.

Its brightness variations were first recognised in 1784 by the York-based amateur astronomer John Goodricke. Although it subsequently came to be regarded as the “prototype” Cepheid variable, it wasn’t the first Cepheid variable discovered – the brightness changes of Eta Aquilae had been discovered a few weeks earlier. However, Delta Cephei is better placed for observation from the UK and consequently it was Delta Cephei that was more closely studied.

DeltaCep_chartThe accompanying chart shows the location of Delta Cephei.

You can follow the brightness changes of Delta Cephei by comparing it with the lettered comparison stars.

Although Delta Cephei is generally described as being a naked eye variable star, the truth of that description depends on the amount of light pollution affecting your observing site.

If light pollution is a problem, then you may find it easier to observe Delta Cephei using 40mm (e.g 8×40) or 50mm (e.g. 7×50) binoculars.

At maximum, Delta Cephei will be almost as bright as comparison A.

At minimum, Delta Cephei will be slighty fainter than comparison E.

Mu Cephei is also a variable star. It varies in brightness much more slowly (and less predictably), typically varying over a range of about half a magnitude every two years.

Guide to Beta Lyrae

An eclipsing variable in which primary and secondary eclipses can be followed visually, as well as smaller scale brightness changes between eclipses.

beta lyr

Although the brightness changes in Beta Lyrae were first recognised in the 1780s, astronomers do still not fully understand what is happening in this system.

The orbital period is just under 13 days and is slowly increasing. Hence eclipse predictions made using old values for the orbital period will be incorrect.

Indeed, it is currently more than 30 orbits “behind” where it should be if predictions were made using the orbital period quoted in the General Catalogue of Variable Stars (GCVS)

The period changes are believed to be related to the transfer of mass between the two stars.

The brightness also varies slightly outside of eclipses because the two stars have distorted each other gravitationally – they have become egg-shaped, rather than spherical, and so their profile changes as the stars move around their orbits. Midway between eclipses, we see the egg-shapes “side on” and hence they appear slightly bigger than when we see then “end on” near eclipses. Consequently, Beta Lyrae appears brightest midway between eclipses and then has already started to fade before the eclipses actually start.

Extreme brightness range 3.4 – 4.3
More typical range always the same range
Period of variation 12.941 days (and slowly increasing)
Frequency of observation Check on every clear night
Observe using Can be observed with the naked eye, but 40mm or 50mm binoculars may also help, especially during eclipses
Visibility Can be observed all year round, but is rather low in the evening sky from January to April

The finder chart in Figure 2 shows you how to locate Beta Lyrae.

You can follow the brightness changes in Beta Lyrae by comparing its brightness with that of the lettered comparison stars.

Figure 2: Finder chart showing comparison stars for Beta Lyrae

At its brightest, Beta Lyrae will be almost as bright as comparison A.

During primary eclipses, it will become almost as faint as comparison G.

Guide to Zeta Geminorum

A Cepheid variable star that varies in a very predictable way, going up and down in brightness every 10.15 days.

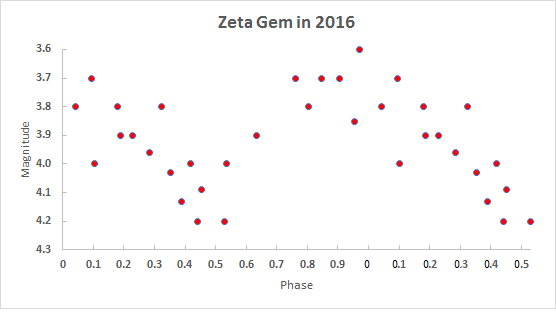
This light curve combines all of the brightness estimates of Zeta Gem made by SPA VSS members during 2016.

For each observation, the phase (i.e. the fraction of the 10.15 day cycle) completed was calculated and this was then plotted along with the magnitude observed.

As can be seen the brightness rises to maximum at the same rate as that with which it fades afterwards.

Zeta Geminorum is a yellow supergiant star whose variations are due to very regular pulsations in the star’s outer layers.

In some ways, Zeta Geminorum is very similar to Delta Cephei. However, as the above light curve shows the rise in brightness is at a similar rate to the subsequent fall in brightness. This contrasts with Delta Cephei – in which the rise is steeper than the fall. The difference occurs because Zeta Gem pulsates in a different way from that with which Delta Cephei pulsates.

Extreme brightness range 3.7 – 4.3
More typical range Always the same brightness range
Period of variation 10.15 days
Frequency of observation Worth checking on every clear night when Zeta Gem is well clear of the horizon and any haze
Observe using Naked eye if you have a reasonably dark observing site

Otherwise, use 40mm or 50mm binoculars

Visibility Can be observed from late August to early May

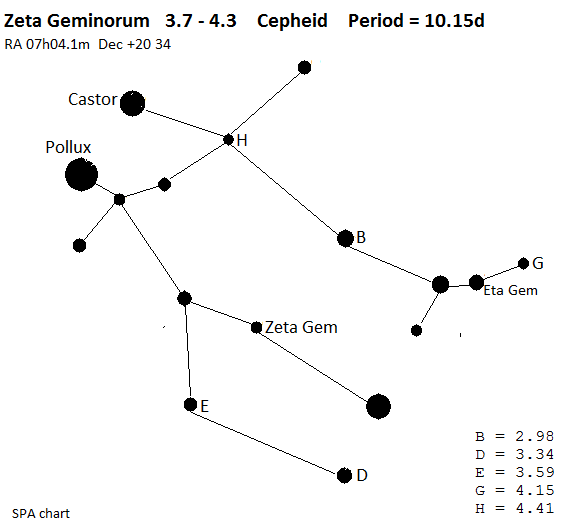
Here is a finder chart that will allow you to locate Zeta Geminorum:

As is the case for Delta Cephei, the brightness changes of this star can be followed with the naked eye if you have a reasonably dark observing site.

However, you may find it easier to use 40mm or 50mm binoculars if light pollution is a significant problem.

At maximum, Zeta Gem will be almost as bright as comparison star E.

At minimum, it becomes fainter than comparison star G.

Take extra care with your brightness estimates when Zeta Gem is low in the sky – try as far as is possible to use comparison stars that are at the same altitude above the horizon as Zeta Gem (otherwise, haze may dim the stars and thus introduce errors).